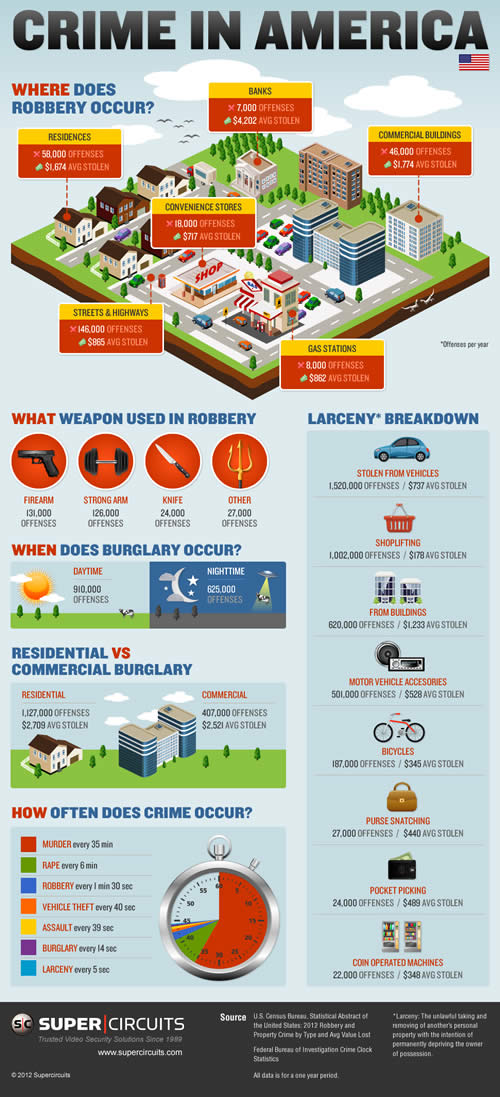
I haven’t posted much about what I have been working on in some time, so I thought I would catch up with a few infographics I have created with my online designer, Ismael.
They all cover topics related to crime as the website for which they were created sells video security products. It is always an interesting process developing an infographic – coming up with a theme, researching the data and then art directing the design through various iterations.
Knowing the work that goes into creating each one, I’m pretty pleased with how they turned out. Click on an infographic to view the original.
Bank Crime in the US

Crime Rates in America

Vehicle Theft in the United States

Burglary by the Numbers


Some very nice work here, i can appreciate it must have taken a while to analyse the data then to come up with the creative direction for each infographic. The top 10 stolen vehicles did catch my eye, the top 5 cars stolen were all Japanese brands, the criminals were obviously more concerned with reliability then speed.
Thanks for sharing.