Despite the popularity of infographics, there are relatively few about e-commerce. Here is a showcase of 15 well designed e-commerce infographics that also present useful data for anyone working in this field (with a few interesting takeaways added by me).
Click on each image to view the full infographic.
The Ascent of E-Commerce
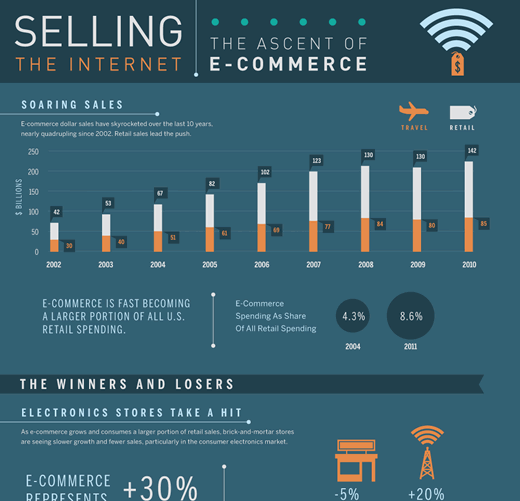
Interesting takeaway: E-commerce doubled from 2004 to 2011, although it still only represents 8.6% of all retail commerce. However, e-commerce accounts for 30% of all consumer electronic sales.
7 Reasons People Fear E-Commerce
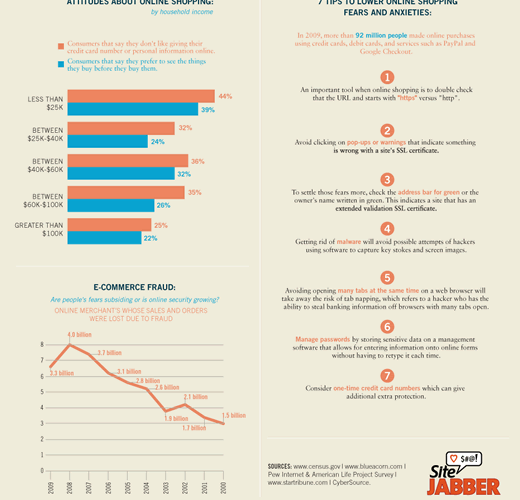
Interesting takeaway: Avoid opening lots of browser tabs at once to prevent tab napping, whereby a hacker has the ability to steal banking information by taking over a tab when the user is not looking at it.
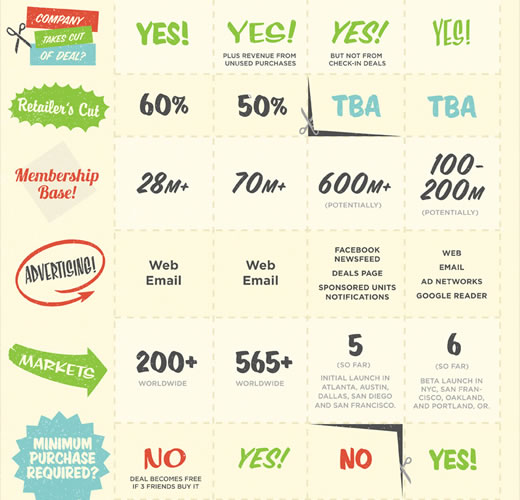
Deals, Deals, Deals … and More Deals
Interesting takeaway: Since it launched in 2008, Groupon has expanded to over 565 markets worldwide.
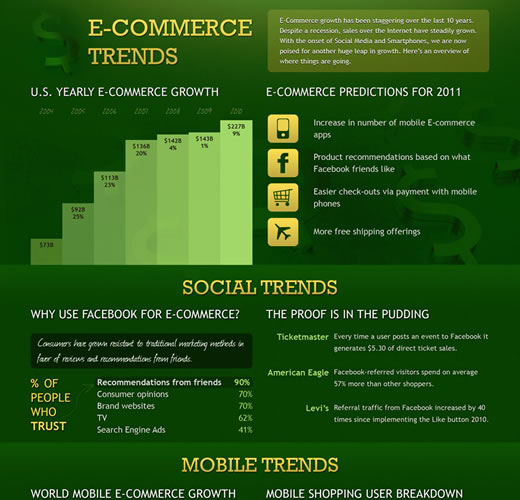
E-commerce Trends
Interesting takeaway: Mobile e-commerce is predicted to increase to $119 billion in 2015 from $1.2 billion in 2009. ‘Regular’ e-commerce is predicted to increase to $1.2 trillion in 2015 from $210 billion in 2009.
The First Moment of Truth is Going Mobile
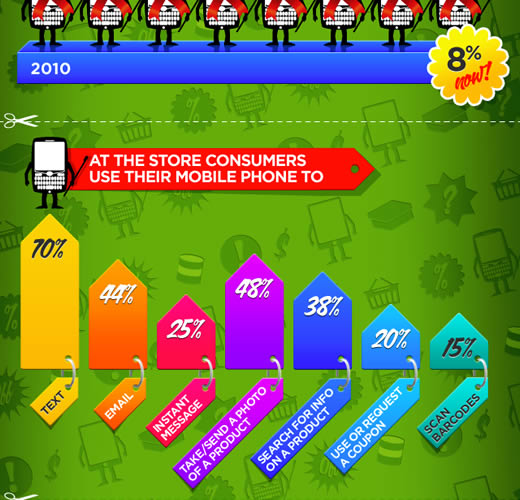
Interesting takeaway: Bar code scanning by mobile phones increased 1600% in 2010.
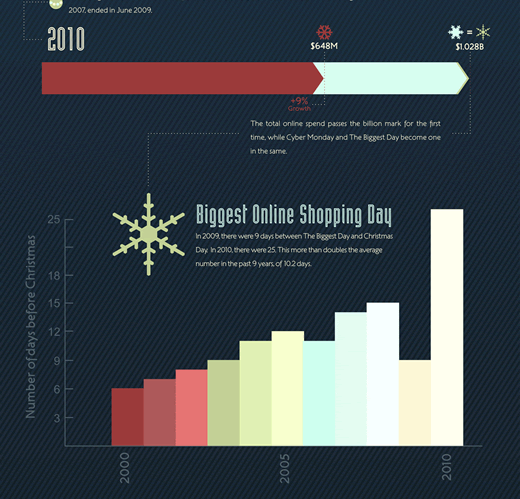
A Historical Look at Online Holiday Shopping
Interesting takeaway: In 2010 the biggest online shopping day was Cyber Monday (November 29). The term “Cyber Monday” was coined by Shop.org in 2005.
The History of E-commerce
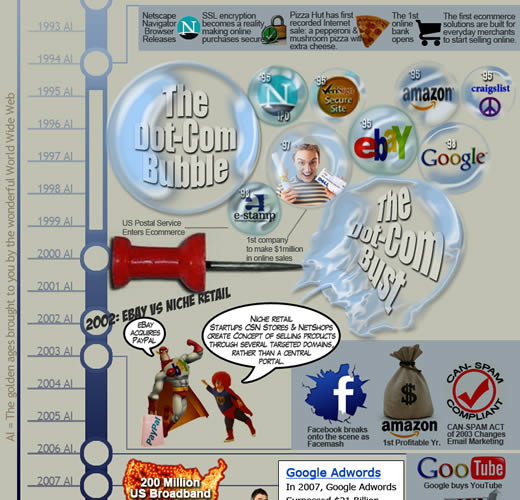
Interesting takeaway: The first home online shopping transaction was in 1984. SSL encryption was introduced in 1994. Also in that year, Pizza Hut had the first recorded Internet sale.
Mobile Warming: Hot Trends in M-Commerce
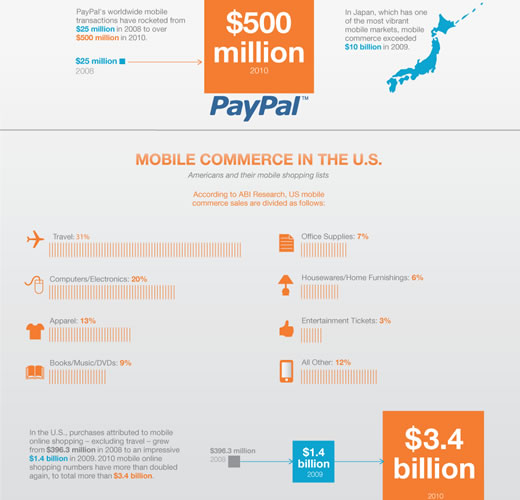
Interesting takeaway: Mobile online commerce in the US increased from $1.4 billion in 2009 to more than $3.4 billion in 2010.
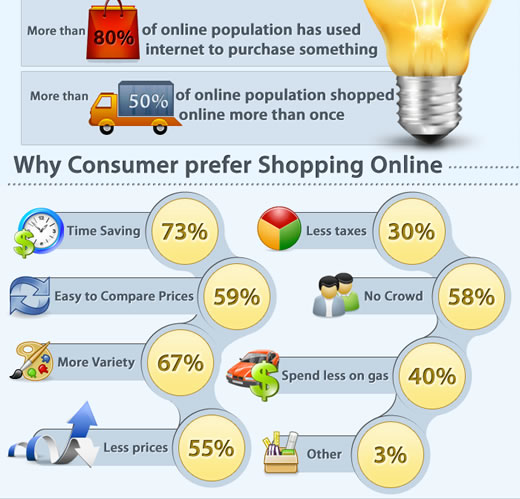
How Big Is The E-commerce Industry
Interesting takeaway: The EU, US, and Asia account for 34%, 29%, and 27% of global e-commerce respectively. The top reason why consumers shop online is to save time, followed by more variety of choices.
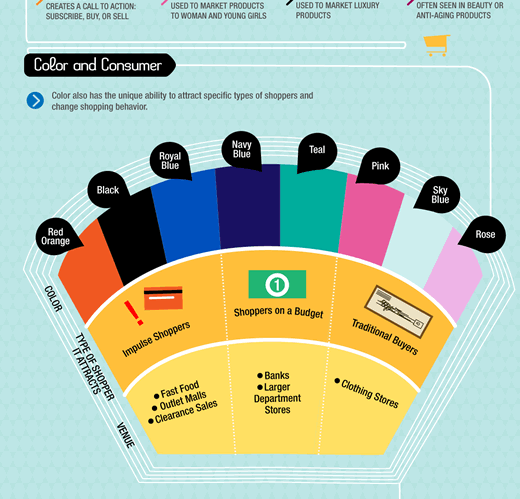
How do Colors Affect Purchases?
Interesting takeaway: 85% of consumers place color as a (note, not ‘the’) primary reason for why they buy a particular product. Navy blue and teal attracts shoppers on a budget.
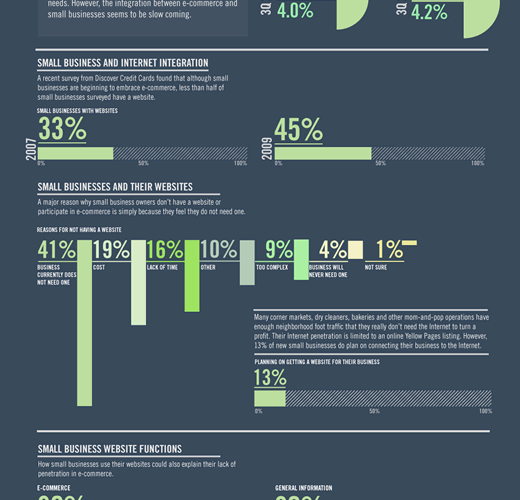
How Small Businesses Are Engaging In E-commerce
Interesting takeaway: The main reason small businesses cite for not having a website is that they don’t need one. Haha, that’s funny.
How Smartphones are Creating Smarter Shoppers
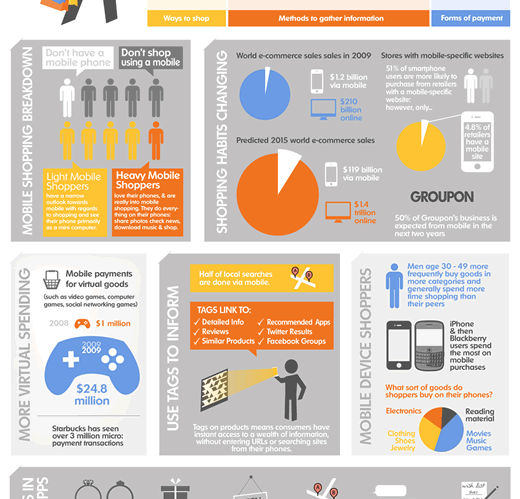
Interesting takeaway: 51% of smartphone users are more likely to purchase from a retailer with a mobile-specific website. However, only 4.8% of retailers have one.
Online Shopping Around The World: How We Spend Our Money Online
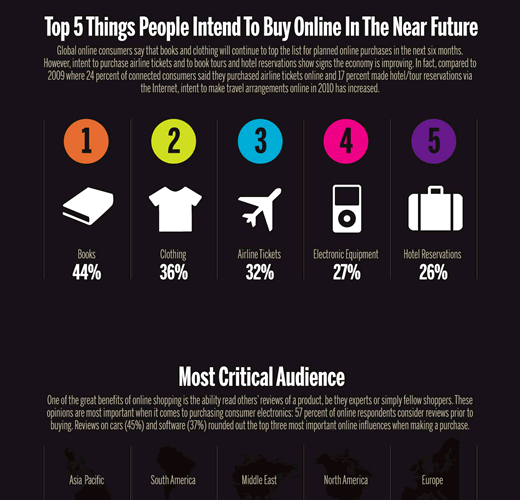
Interesting takeaway: 57% of people purchasing electronics consider online reviews before buying. Books are the top product type purchased online followed by clothing.
What are People Really Buying Online?
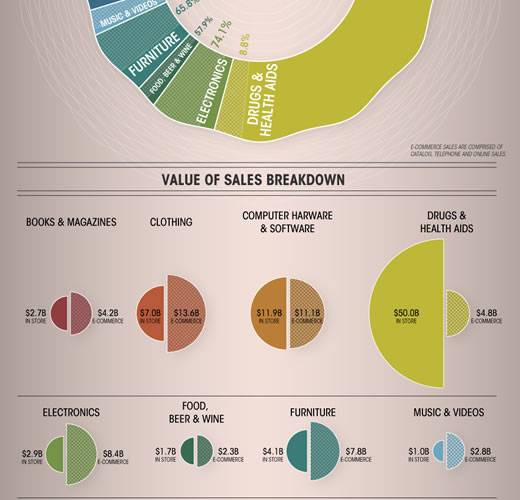
Interesting takeaway: In the US in 2010, online purchases accounted for 74% of all music & video sales; the same was true for electronics. Online represented 66% of all clothing purchases.
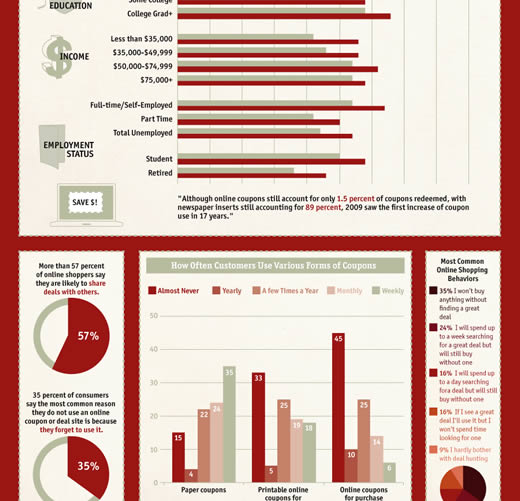
Who’s Using Coupons?
Interesting takeaway: Over 57% of US online shoppers say they are likely to share deals with others. The most common reason (35%) why consumers do not use an online coupon or deal site is because they forget.
nice collection, thanks for sharing
These are exceptional! Well, the bubble effect on the The History of E-commerce is a bit much. Here’s some additional info about e commerce that we’d like to share:
http://bit.ly/jPcZUj
Wow great work. I absolutely love this.
Great post.
Very cool. Just found this blog searching for design ideas and this is going into my bookmark.
Cool… its really interesting
Good work! Keep it up!
Some of these look great, good article thanks for posting.
These will be useful in convincing some of those clients I run into that are on the fence about setting up e-commerce for their business that it is worth the investment.