
The Interactive Advertising Bureau, IAB, surveyed mobile users from 19 countries around the world for their mobile commerce study “Mobile Commerce: A Global Perspective.”
The resulting report and infographic provide some valuable insights about mobile ecommerce around the globe.
Highlights and Key Takeaways
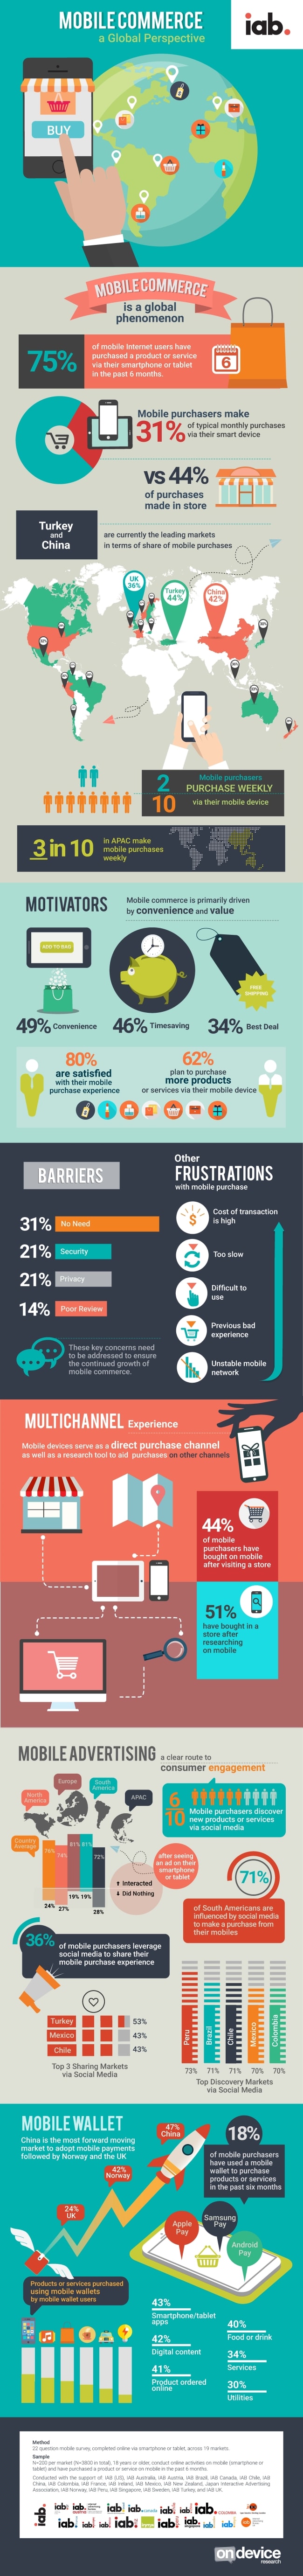
75% of mobile internet users have purchased a product or service via their mobile device in the past 6 months.
Mobile purchasers make 31% of typical monthly purchases via their mobile device, versus 44% made in-store.
Turkey and China are the two leading markets in terms of share of mobile purchases.
Motivators for Mobile Commerce
Mobile commerce is primarily driven by convenience and value:
- 49% Convenience
- 46% Timesaving
- 34% Best deal
80% of mobile shoppers are satisfied with their mobile purchase experience.
62% plan to purchase more products or services via their mobile device.
Barriers to Mobile Commerce
Barriers that need to be addressed to ensure the continued growth of mobile commerce:
- 31% No need to shop from their phone
- 21% Security concerns
- 21% Privacy concerns
- 14% Poor reviews from other shoppers
Other common user frustrations with mobile commerce include high cost of transactions (e.g. shipping fees), taking too long to make a mobile purchase, difficult to use mobile sites or apps, previous bad experiences, and unstable mobile networks.
Multi-Channel Commerce
Mobile devices serve as a direct purchase channel as well as a research too to aid purchases on other channels:
- 44% of mobile purchasers have bought on a mobile device after visiting an offline store.
- 51% have bought in a store after researching on a mobile device.
Mobile Advertising
60% of mobile shoppers discover new products or services via social media. 71% of South Americans are motivated by social media to make a purchase from their mobile device.
38% of mobile purchasers use social media to share their mobile purchase experience.
Mobile Wallet
18% of mobile purchasers have used a mobile wallet to purchase products or services in the last 6 months.
China is the leading market to adopt mobile payments (47%), followed by Norway (42%) and the UK (24%).
Products and services purchased using mobile wallets:
- 43% Smartphone apps
- 42% Digital content
- 41% Product ordered online
- 40% Food or drink
- 34% Services
- 30% Utilities